Instrument Familiarization - Oscilloscope
Except when dealing with a pure DC voltage, it is desirable to observe how the voltage varies with time. The Oscilloscope has a graphical display with a vertical voltage scale and and a horizontal time scale, to facilitate viewing time varying or AC signals.
Answer all questions on the lab printout.
Pre-Lab
1. Read through this document to familiarize yourself with the
equipment that you will be using in the lab.
2. Click on the following link. A word document will appear. Print out
the document and bring it to the lab. Remember, if you come to the lab
without the printed document then you will have not completed your pre-lab, which will result in a loss of marks for this lab.
Purpose
This exercise aims to familiarize the student with the oscilloscope.
Equipment
Oscilloscope
Function Generator
Coaxial Cable with BNC Connectors
Procedure
Turn the oscilloscope on and turn:
- VERTICAL, MODE switch to CH 1
- AC/GND/DC switch to the AC position
-TRIGGER, MODE
switch to the P-P AUTO position
Play with the
following controls and observe and record their function and/or purpose:
1 - INTENSITY
2 - FOCUS
3 - VERTICAL, POSITION
4 - HORIZONTAL, POSITION
| When adjusting the INTENSITY and FOCUS, you should get a fine
line. If the INTENSITY is made too intense (the line becomes fat and blooms) and can damage the coating on the
screen. Describe the purpose of these controls on the Lab 4 Data Sheet. |
5. Adjust the SEC/DIV knob for a slow sweep rate. Increase/decrease the sweep rate. Describe the purpose of this control on the Lab 4 Data Sheet.
Apply a sinusoidal signal of 1 kHz from a function generator to VERTICAL, CH 1 BNC connector. Show me how (CH 2 input works the same as CH1.) Adjust the VOLTS/DIV control to obtain a display covering more than half the screen (in the vertical direction). Also set:
| VERTICAL, CH 1: | AC/GND/DC | AC |
| TRIGGER: | MODE | P-P AUTO (peak-to-peak automatic) |
| SOURCE | CH (channel) 1 or 2 as appropriate | |
| SLOPE | Positive | |
| LEVEL | adjust to obtain a display trace starting close to zero amplitude | |
| HORIZONTAL Sweep: | SEC/DIV | so that 2 cycles of the input waveform are displayed |
It should look similar to one of these:
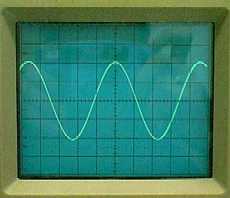
|
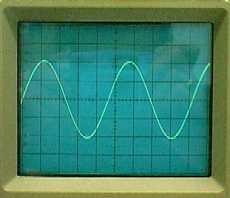
|
6. Describe the purpose of the VOLTS/DIV control on the Lab 4 Data Sheet.
7. Change the TRIGGER, MODE switch to the NORM (normal) position. If the trace disappears, readjust the TRIGGER, LEVEL control. Explain what is happening and describe the purpose/difference of the P-P AUTO and NORM positions of the TRIGGER, MODE control, on the Lab 4 Data Sheet.
8. Switch between VERTICAL, AC and VERTICAL, DC. Do you notice the position of the trace shifts vertically? If not, adjust the DC OFFSET control on the Function Generator when the VARTICAL, AC/DC switch is in the DC position. The trace should shift vertically with the control. If this is now observed, switch back to AC. Does the trace now shift vertically with the DC SHIFT control on the Function Generator? Explain what the purpose of the AC/DC switch is on the Lab 4 Data Sheet.
9. Switch The TRIGGER, MODE switch to P-P AUTO and the between VERTICAL, AC or VERTICAL, DC and VERTICAL GND (ground). The trace displayed will be the signal seen above or a straight line. Explain the purpose of the AC or DC switch positions and GND on the Lab 4 Data Sheet.
10. Study and experiment with the two TRIGGER, SOURCE switches. Explain the purpose of the TRIGGER, SOURCE switches on the Lab 4 Data Sheet.
11. Study and experiment with the two TRIGGER, SLOPE switch. Explain the purpose of the TRIGGER, SLOPE switch on the Lab 4 Data Sheet.
12. Switch The TRIGGER, MODE switch back to NORM. Study and experiment with the
two TRIGGER, LEVEL switch. Explain the purpose of the
TRIGGER, LEVEL switch on the
Lab 4 Data Sheet.
13. Measure the amplitude of the input signal. Show me how Record the result on the Lab 4 Data Sheet providing the VOLTS/DIV switch setting, the number of vertical divisions (between maximum and minimum of the trace (peak-to-peak number of divisions)) and the resulting VPP.
14. Measure the period of the signal. Show me how Record the result on the Lab 4 Data Sheet providing the SEC/DIV switch setting, the number of horizontal divisions for one complete cycle and the resulting time.
15. Calculate the frequency of the signal. Show me how Record the result on the Lab 4 Data Sheet.
Results
Submit your typed Lab 4 Data Sheet as the Lab Report.